
Overview
The Helpline Safety Query Beta Report provides a near real time view of safety query cases raised through the Helpline module, helping users monitor case volumes, identify trends, compare performance across locations, and track case management activity through charts and detailed data tables.
How do these new reports benefit me?
- Broader visibility: Quickly understand where cases are being raised across locations at a glance.
- Near real time information: Unlike the old classic reports our new reports refresh information every 20 minutes.
- Trend awareness: Simple charts show month-by-month changes and emerging case types.
- Focus attention where it matters: Clearly shows which areas experience the highest volume of cases.
- Identify patterns: Compare case trends across locations to build a clearer picture of performance.
- Reinforce accountability: Transparent ownership supports consistent and timely case management.
How do I access the new style ‘Safety Query’ report
-
- Navigate to the Helpline Module
- Click on the ‘Reports-Beta’ tab
- Click on ‘Safety Query’

‘Safety Query’ Report Breakdown
Page Level Filtering:
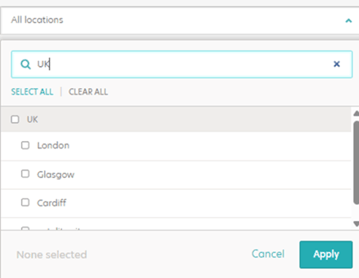
- Location: The ‘Safety Query’ report defaults to display data for all locations you have access to. You can narrow your focus using the Location Selector filter, charts and data grids update immediately reflecting data based on the chosen location(s).
- Date Range: The ‘Safety Query’ report displays data for the last 31 days, counted back from the current day. To pick a start and end date of your choosing in the From and To fields, with a maximum range of up to five years. Once applied, all charts and tables update to reflect the selected timeframe, except for the Cases Created chart, which always displays the last 12 months.

Special note:
The report displays each case based on its status during the selected dates, e.g. if a case is currently closed but was open on the last day of the selected time-period, it will appear as Open in the report. This ensures that the data reflects the accurate historical status of each case for the period you are analysing.
Data Charts:
Primary information card
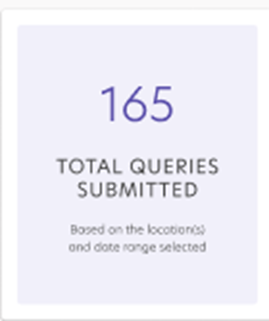
- Total Queries Submitted – These figures display the total number of safety queries submitted based on the selected filters.
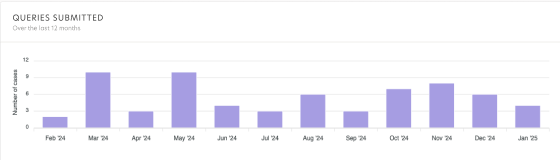
- Queries submitted: A 12-month bar chart with the number of Safety Query cases submitted each month.
Secondary information card
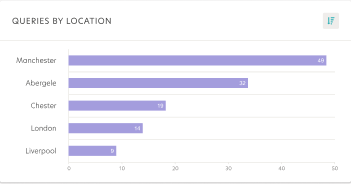
- Queries by Location: This chart highlights the top five locations involved in reported Safety Query cases, with a sort option to view the top five or bottom five locations.
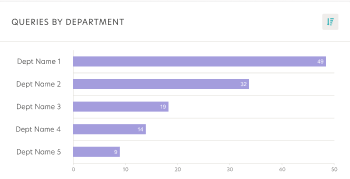
- Queries by Department: This chart highlights the top five departments involved in open Safety Query cases, with a sort option to view the top five or bottom five departments.
Data Grid on screen display
- The data grid has one tab, which allows you to see more information about each safety query raised.
- Whether you're looking for further insights or sharing information across teams the ‘Export Data' button, will export the data currently displayed in the tabular data grid and receive the output of your report in a convenient CSV file format allowing for further analysis and offering flexibility with ease of use.
Advice:
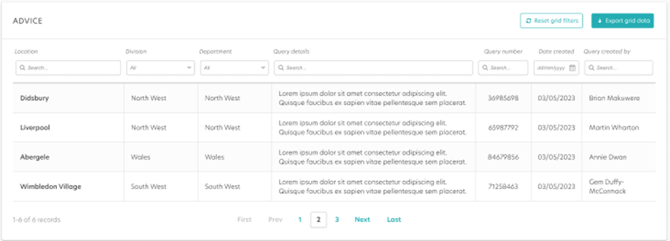
The ‘Safety Query’ table provides a detailed view on the page including:
- Location
- Division
- Department
- Query details
- Query number
- Date created
- Query created by
Want more information? Additional information is provided if you extract the table which includes:
- Case status
Download and Export
The addition of the 'Download PDF' button gives the ability for you to capture a comprehensive snapshot of the current page, including charts and graphs. By simply clicking this option, you can generate a PDF file, ready for sharing, further analysis or archival. This is designed to eliminate the need for manual creation of charts based on information available in RiskProof saving time.
Classic report phase-out information
The reports will be rolled out in phases into BETA and made available to everyone to play with and use and feedback. Classic reports will remain available during this period.
After a period of one month when all reports have been released to BETA classic report access will be removed.
We encourage users to start using the new reports now to familiarise themselves with the enhanced functionality ahead of a future transition.
What’s Next?
We are continuing development of the Helpline reporting suite with the upcoming Visit report.
Once released, users will be able to analyse Maintenance and Miscellaneous cases using filters within the Helpline Cases Overview report.