
Introduction
The Helpline Reports area gives users one place to analyse Helpline activity across their organisation. Interactive charts, summary information and detailed case tables help users monitor trends, understand where cases are occurring and investigate individual records in more detail.
Accessing Helpline Reports
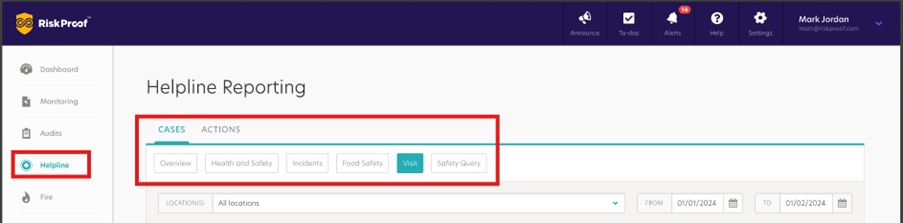
Use these steps to access the reporting area:
-
Navigate to the Helpline module.
-
Select the Reports tab.
-
Choose the report category that matches the type of case information you want to analyse.
Common Features
All Helpline reports follow a similar layout and include several common features.
Filters
Reports can be filtered by:
- Location
- Date range
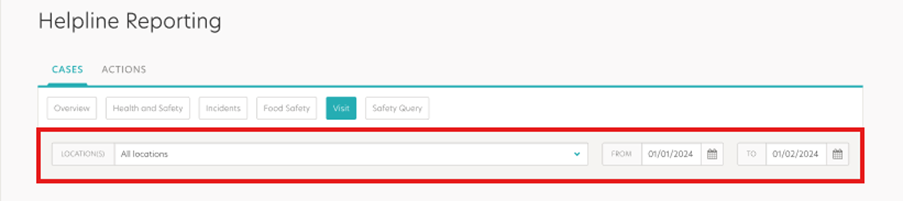
This allows users to focus on specific areas of the business or analyse activity over a chosen period.
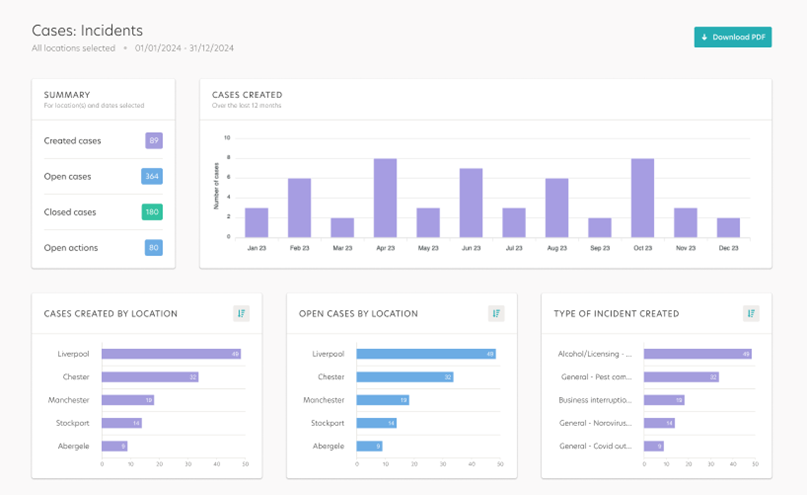
Once the date filter is applied, all charts and tables update to reflect the selected timeframe, except for the primary bar chart, which always displays the last 12 months.
Special note:
The report displays each case based on its status during the selected dates, e.g. if a case is currently closed but was open on the last day of the selected time-period, it will appear as Open in the report in charts such as the Summary. This ensures that the data reflects the accurate historical status of each case for the period you are analysing.
Visual Analysis
Reports include charts and summary information that help users:
- Monitor case volumes.
- Identify trends over time.
- Compare activity across locations.
- Highlight areas that may require further investigation.
Detailed Data Tables
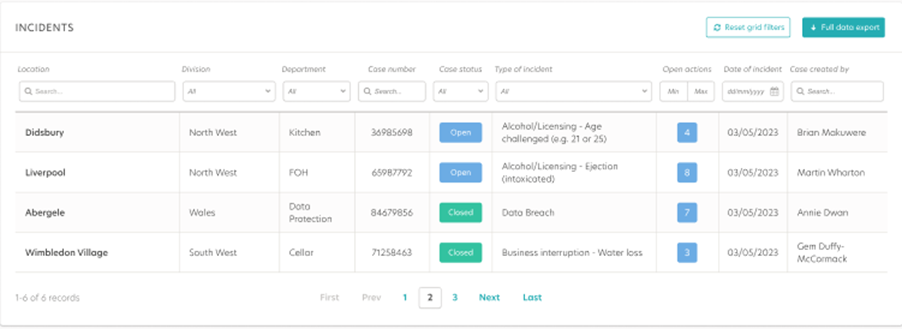
Each report includes one or more data tables containing the records behind the charts, allowing users to review individual cases and supporting information in greater detail.
Exporting Information
Users can:
- Export table data for further analysis.
- Download PDF versions of reports for sharing and record keeping.
Report Categories
Although each report focuses on a different case category, the layout, filtering options and export tools are designed to work consistently across the Helpline reporting suite.
The Helpline reporting suite includes dedicated reporting for the following case categories:
- Cases Overview
- Health & Safety
- Food Safety
- Incidents
- Visits
- Safety Queries
- Actions
Each report focuses on the information most relevant to that case category whilst maintaining a consistent reporting experience.
Maintenance and Miscellaneous Cases
Maintenance and Miscellaneous cases do not have dedicated report categories.
To analyse either type of case, use the Cases Detail table in the Cases Overview report after filtering the primary category to the relevant value:
- Open the Cases Overview report.
- Set the primary Case Category filter to Maintenance or Miscellaneous.
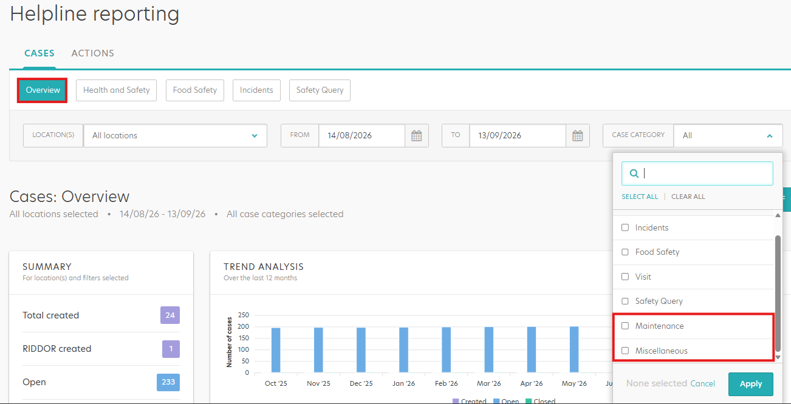
- Navigate to the Cases Detail table at the bottom of the page.

Using Reports Effectively
For most reporting requirements, the recommended approach is:
- Start in Cases Overview for a broad view of activity.
- Apply location and date filters to narrow your focus.
- Use category-specific reports when you need more detailed analysis of a particular case type.
- Use the detailed tables and export functionality to investigate individual records further.
Monitoring Open Actions
Within the Actions report, open actions represent tasks that have been assigned but are yet to be completed. Monitoring open actions can help users:
- Identify outstanding work requiring attention.
- Highlight locations with high volumes of overdue or incomplete activity.
- Monitor follow-up activity resulting from incidents, visits, audits or investigations.
- Track whether issues are being progressed towards resolution.
- Prioritise areas requiring management intervention.
As a best practice, users should regularly review open actions alongside case volumes and trends to ensure that reported issues are not only being raised but are also being resolved effectively. The summary cards across reports include open action counts to provide a quick indication of outstanding workload.